Challenge completed
Energy Revolution @ Gelsenwasser Quartier
In order to counteract climate change and implement the energy turnaround, new approaches and ideas are needed, especially in the area of energy supply. GELSENWASSER AG already actively supports the energy turnaround by generating and using renewable energy itself. CO2 emissions are continuously reduced by energy efficiency measures. We need innovative ideas and your support in order to achieve our goal of supplying our own company while emitting as few emissions as possible. Think global, act local - work for emission-free Gelsenkirchen!
Knowledge Base
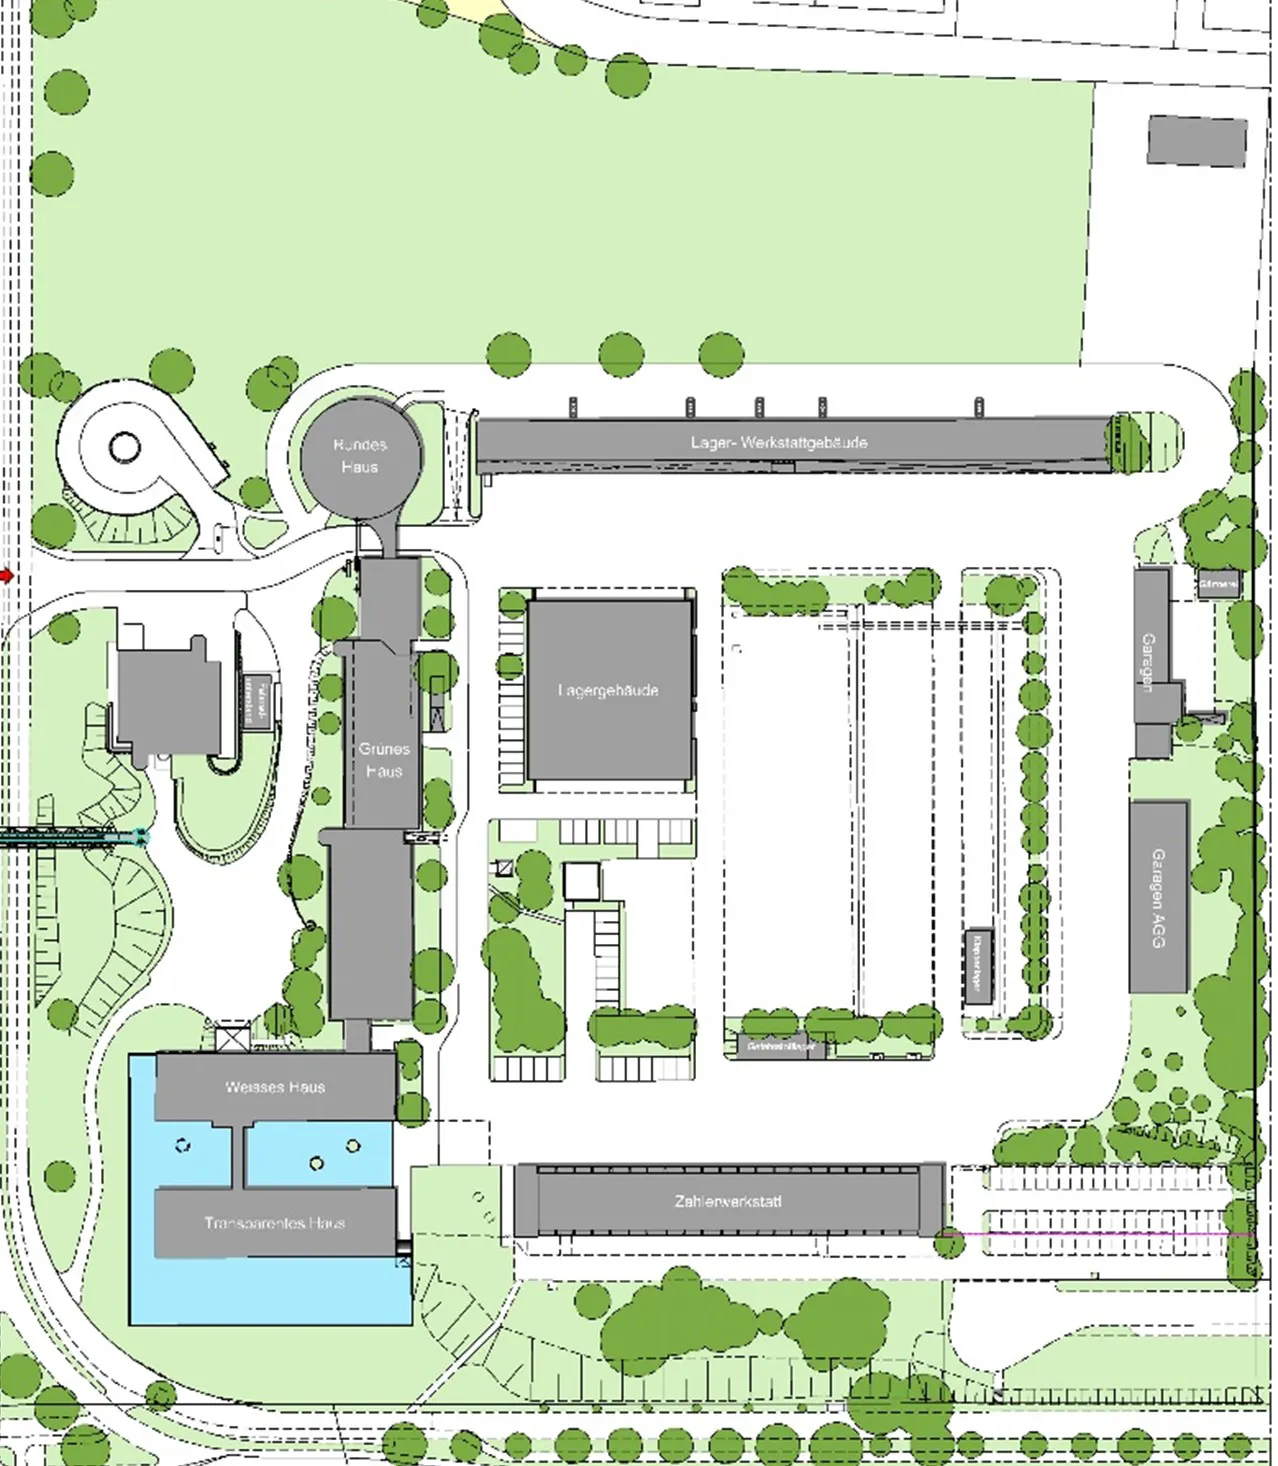
Below is a list of the site's energy requirements that should be covered by the concept. An energy management system is used that shows consumption in its temporal progression. As an example, the electricity load curve of the Gelsenkirchen headquarters is shown in the graphics below. These are taken from the GELSENWASSER energy management system and can be provided in more detail or as a data record if required.
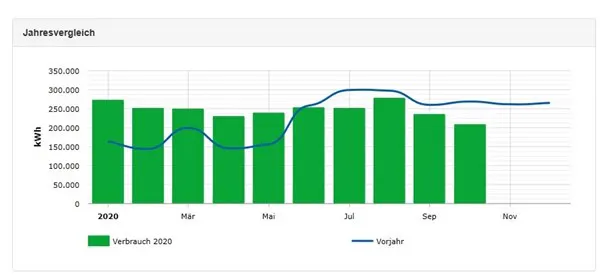
In order to be able to estimate the magnitude of the necessary energy supply plants, Figure 2 shows the annually required electricity quantities. A comparison with the previous year shows that the total electricity demand in 2020 has not decreased significantly.
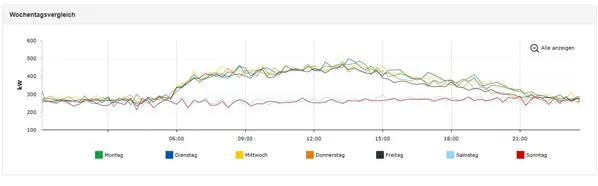
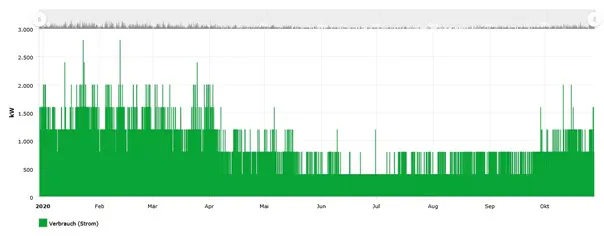
Figure 3 shows a typical weekly load profile. Clearly visible is the necessary base load supply, which must also be covered on weekends.
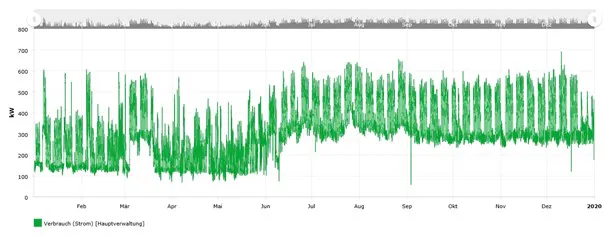
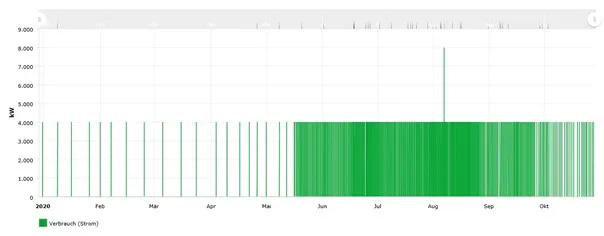
Figure 4 shows the quarter-hourly load curve for 2019, which provides information on the time and duration of electricity consumption and thus provides the basis for electricity generation plants for own consumption.
Just like the quarter-hourly load profile of the electricity consumption, these load profiles are also available for the site's heating and cooling requirements. These are shown in Figures 5 and 6 below.